ECONOMIC IMPACT OF THE NATIONAL
GST CENTRE IN SUMMERSIDE,
PRINCE EDWARD ISLAND
22 December 2005
T he Honourable Percy Downe
Room 702
Victoria Building
The Senate
Ottawa
Dear Senator Downe:
Further to your request of 7 November 2005, enclosed is a paper entitled Economic Impact of the National GST Centre in Summerside, Prince Edward Island .
Should you require further information on this subject, please do not hesitate to contact the Parliamentary Information and Research Service.
Yours sincerely,
Tara Gray
Economics Division
Parliamentary Information
and Research Service
*****************************************************************
ECONOMIC IMPACT OF THE NATIONAL
GST CENTRE IN SUMMERSIDE,
PRINCE EDWARD ISLAND
INTRODUCTION
This paper discusses the economic impact of situating the national GST centre in Summerside, Prince Edward Island (P.E.I.). The decision to locate the centre in P.E.I. was made following the closure of the military base in Summerside. The closure sparked an intensive effort by the public and private sector to identify and attract new economic activities to the area, an effort which was largely successful.
Accordingly, the economic impact of the government's decision cannot be easily isolated from other efforts to mitigate the impact of the closure. The analysis is also complicated by the lack and consistency of historical data for the Summerside area and for the Canada Revenue Agency. ( [1] ) Thus, a rigorous economic impact analysis is not possible, although some information has been compiled from the available data sources.
BACKGROUND
A. Base Closure and Government Response
In April 1989, the federal government announced the closure of the Canadian Forces Base in Summerside. The announcement, part of a larger series of measures to curb defence spending, was made by means of the 1989 Budget speech. The decision was unexpected and generated substantial community resistance to the closure. A task force, consisting of representatives from the local community, and the municipal and provincial governments, was quickly established to examine the impact of the closure and review alternative courses of action.
The 49-year old military base was a source of stable employment for the area and had served as the community's economic mainstay for decades. The task force reported that during 1988, the base provided direct employment for 1,304 people - 945 military personnel and 359 civilian personnel were assigned to or supported by the base. Total annual personnel costs for fiscal year 1988/89 were approximately $40 million. The costs to operate and maintain the base (facilities and equipment) were approximately $36 million of which an estimated $11 million was spent locally. ( [2] ) The task force found that the socio-economic impact of the closure on the community and on the Island would be substantial, estimating that the closure would remove 33% of the income from the CFB Summerside area. In all, up to 5% of the total provincial population would be affected, accounting for 5% of total provincial income. ( [3] )
In light of the closure's effect on the community, the group recommended to Ottawa that it keep the base open or, failing that, identify new economic activities for the area. The Prime Minister and P.E.I. premier subsequently agreed to a three-pronged approach: that the base itself would be used for alternative purposes; that the existing food processing sector in the area would be expanded; and, that new public sector employment would be created or transferred to Summerside. ( [4] ) A new federal committee was established to co-ordinate federal efforts, led by the Atlantic Canada Opportunities Agency (ACOA).
B. The Slemon Park Corporation
In 1989, a decision was made to privatize the base facilities. The federal government turned over the base and its assets in trust to a new entity, the Slemon Park Corporation (SPC), along with an initial $15 million in federal and provincial funding. The SPC, ACOA, and the federal government subsequently met with a number of private firms to attract them to Summerside. In addition to the substantial financial assistance provided to private firms relocating to the base, ( [5] ) the SPC was able to attract prospective companies with the suspension of provincial sales, property, and corporate income taxes until the year 2012. Under the terms of the contribution agreement, the corporation was to become self-sufficient by the year 1997 and was to create 500 direct and indirect jobs by the year 1995.
A comprehensive review conducted by ACOA in 1995/96 found that the SPC continued to make significant progress towards meeting its objectives and had exceeded its job creation targets. ( [6] ) By August 1997, a total of 627 people worked at various enterprises at Slemon Park. ( [7] ) Businesses currently located in Slemon Park include Atlantic Turbines International Inc., Honeywell Engines and Systems, Testori Americas, MDS-PRAD Technologies Corporation, Tronosjet Maintenance Inc. and Holland College's Aerospace and Industrial Technology Centre, the training arm for the aerospace industry.
C. Goods and Services Tax Processing Centre
In addition to efforts to attract private sector firms to the area, officials were also pursuing the public sector. In 1990, after an intensive lobbying effort, the government made the decision to locate a Goods and Services Tax (GST) processing centre in Summerside. It was expected to create 400 full- and part-time jobs; by late 1993, the year it started operations, about 550 people were employed at the centre and it had an annual payroll of an estimated $16 million. ( [8] )
ECONOMIC IMPACT
A. Base Closure
It is difficult to isolate the economic effects of locating the GST processing centre in Summerside from the other, largely successful, efforts to attract other businesses to the area. Government assistance clearly helped mitigate the negative impact of the base closure on the local economy. In the end, the region may have benefited from the loss, given the diversification of the economic base that occurred in the years following the closure (see Table 5, Appendix A: Summerside Employment by Industry, 1996 and 2001).
Statistics Canada census data from both before and after the closure announcement, as well as data from the Treasury Board and other government sources, provide a historical evaluation of the local economy. One measure of impact on the local labour force situation can be obtained using data from the Census. However, these comparisons are limited due to a change in the geographical definition for the Summerside area that occurred in the 1996 Census.
Table 1:
Census of Population:
Summerside's Economic Characteristics
|
1986 |
1991 |
1996 |
2001 |
Population |
8,020 |
7,484 |
14,525 |
14,654 |
|
|
|
|
|
Total Labour Force |
3,895 |
3,590 |
6,800 |
7,655 |
Participation Rate (%) |
62.9 |
62.6 |
67.3 |
67.4 |
Unemployment rate (%) |
15.7 |
14.9 |
10.5 |
11.4 |
Total Income
Composition (%) |
|
|
|
|
· Employment |
70.2 |
67.6 |
n/a |
71.4 |
· Government
transfers |
19.2 |
21.9 |
n/a |
17.8 |
· Other |
10.6 |
10.5 |
n/a |
10.8 |
Source: Statistics Canada, Census of Population.
Following the base closure, 1991 Census data show that although the unemployment rate fell, the percentage of total income obtained from government sources increased. Employment seemed to have recovered by the 1996 Census (refer to Appendix A, Table 6 for more detailed labour force statistics).
Labour force survey data from 1987 to 2004 provide a broader view of the impact of the closure on the area and the subsequent expansion of public and private sector activity. While the unemployment rate is consistently higher in Summerside as compared to the Island's other major urban centre, Charlottetown, the differences were most pronounced in the years immediately following the base closure. By 1995, the unemployment rate had fallen to close to the same level as before the base closure. It is likely that the opening of the GST centre was a contributing factor. (Caution should be used in linking the increase in the unemployment rate directly to the base closure - other factors could be at play including the strength of the other key sectors in the area such as fisheries and tourism.)
Chart 1:
Unemployment Rate, P.E.I. Major Urban Centres
1987-2004
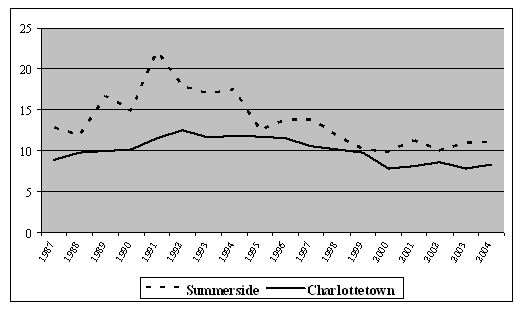
Source: Labour Force Survey, Statistics Canada.
B. The GST Processing Centre
Due to the change in status of the former Department of National Revenue to the Canada Customs and Revenue Agency (CCRA) and subsequently renamed the Canada Revenue Agency (CRA), detailed employment statistics are not available for the CRA after 1999. From 1993 to 1999, the number of positions within the CRA in P.E.I. grew from 220 to over 850 full and part time positions. While it is not possible to determine from the available data the exact location of these positions on the Island, the majority of the growth in employment is most likely due to the GST centre in Summerside, and not an expansion of positions located in Charlottetown.
Table 3:
P.E.I. Public Service Active Employment
Revenue Canada*
Year |
1993 |
1994 |
1995 |
1996 |
1997 |
1998 |
1999 |
Employment |
270 |
710 |
718 |
789 |
818 |
852 |
850 |
Source: The Treasury Board and the Public Service Human Resources Management Agency.
* Revenue Canada refers to the combined data for the Canada Customs and Revenue Agency, the Department of National Revenue (Taxation), and the Department of National Revenue (Customs and Excise).
In all, Revenue Canada (see definition in note to Table 3 above) represented some 5.7% of all federal government positions on the Island in 1999. About 60,200 people were employed in P.E.I. in 1999, making the contribution of Revenue Canada to overall provincial employment levels about 1.4%. Moreover, the majority of positions at Revenue Canada are full-time, smoothing some of the fluctuations of the highly seasonal local island economy.
Table 4:
Labour force characteristics
1999 Prince Edward Island
|
Population |
Labour
Force |
Employment |
Full-time
Employment |
Public Sector
Employment |
Unemployment
Rate* |
1999 |
136,296 |
70,300 |
60,200 |
50,000 |
14,749 |
14.4% |
Source: Statistics Canada, Labour Force Survey Estimates, Annual 1999.
* The unemployment rate is the number of unemployed persons expressed as a percentage of the labour force.
Conducting a full economic impact analysis would require the detailed budgetary expenditures of Revenue Canada in Summerside, including wages and salaries. This level of detail is not available. According to the 1999 Report of the Auditor General of Canada ( Chapter 16 Goods and Services Tax: Returns Processing and Audit ), in 1998 the GST centre employed the equivalent of about 660 full-time employees, and cost about $28 million a year to operate. It is not clear if this includes all expenditures at the Summerside processing centre. If so, it would represent a considerable investment in the P.E.I. economy, equivalent to about 1% of the entire provincial GDP in 1998.
The processing centre is an important employer in Summerside, employing an estimated 10% of the 6,800 people in the active labour force in the Summerside area (using data obtained from the 1996 Census and the City of Summerside), making the centre one of the largest employers in the area (refer to Appendix A: Table 5: Summerside Employment by Industry, 1996 and 2001).
CONCLUSION
The economic impact of the decision to locate the GST processing centre in Summerside cannot be easily isolated from other, largely successful government efforts to mitigate the impact of the closure. The analysis is also complicated by a lack of comparable historical data on the Summerside area and detailed expenditure data for Revenue Canada in Summerside. Thus, a rigorous economic impact analysis was not possible.
From the available data, it can bee seen that the GST processing centre is a major employer in the area, employing an estimated 10% of the Summerside labour force in 1996. The majority of these positions are full time, smoothing some of the fluctuations of the highly seasonal local island economy. Based on the latest available data from 1998, the GST processing centre represented a considerable investment in the P.E.I. economy, equivalent to about 1% of the entire provincial GDP at the time.
APPENDIX A
Table 5:
Summerside Employment by Industry
1996 and 2001
Table 6:
Select Labour Force Statistics
APPENDIX A
Table 5:
Summerside Employment by Industry
1996 and 2001
Industry Group |
1996 Employees |
% Distribution |
2001 Employees |
% Distribution |
Total Labour Force 15 Years and Older |
7,415 |
- |
8,605 |
- |
Primary Industries |
250 |
3.4% |
555 |
6.7% |
Manufacturing Industries |
875 |
11.8% |
1,170 |
13.6% |
Construction Industries |
535 |
7.2% |
440 |
5.1% |
Transportation and Storage |
380 |
5.1% |
270 |
3.1% |
Communication and Other Utility |
115 |
1.6% |
180 |
2.1% |
Retail and Wholesale Trade |
1,370 |
18.4% |
1,335 |
15.5% |
Finance, Insurance, and Real Estate |
570 |
7.7% |
275 |
3.2% |
Government Service Industries |
750 |
10.1% |
935 |
10.9% |
Educational Services Industries |
440 |
5.9% |
395 |
4.6% |
Health and Social Services |
820 |
11.1% |
915 |
10.6% |
Other Service |
1,310 |
17.6% |
2,135 |
24.6% |
Source: City of Summerside.
TABLE 6: SELECT LABOUR FORCE STATISTICS
Charlottetown
|
Population
(x 1,000) ( [9] ) |
Labour Force
(x 1,000) ( [10] ) |
Unemployment
Rate ( [11] ) |
Participation
Rate ( [12] ) |
Employment
Rate ( [13] ) |
1987 |
40.1 |
25.9 |
8.9 |
64.6 |
58.9 |
1988 |
40.5 |
26.6 |
9.8 |
65.7 |
59.3 |
1989 |
40.9 |
27 |
10 |
66 |
59.4 |
1990 |
41.5 |
28.3 |
10.2 |
68.2 |
61.2 |
1991 |
42 |
28.6 |
11.5 |
68.1 |
60.5 |
1992 |
42.5 |
28.7 |
12.5 |
67.5 |
59.1 |
1993 |
43.1 |
29.4 |
11.6 |
68.2 |
60.3 |
1994 |
43.7 |
29.7 |
11.8 |
68 |
60 |
1995 |
44.2 |
29.8 |
11.7 |
67.4 |
59.5 |
1996 |
44.8 |
30.5 |
11.5 |
68.1 |
60.3 |
1997 |
45.3 |
30.6 |
10.5 |
67.5 |
60.5 |
1998 |
45.6 |
30.5 |
10.2 |
66.9 |
60.1 |
1999 |
45.9 |
30.7 |
9.8 |
66.9 |
60.6 |
2000 |
46.2 |
31.9 |
7.8 |
69 |
63.6 |
2001 |
46.7 |
32.1 |
8.1 |
68.7 |
63.4 |
2002 |
47.2 |
32.7 |
8.6 |
69.3 |
63.3 |
2003 |
47.8 |
33.3 |
7.8 |
69.7 |
64.2 |
2004 |
48.4 |
33.7 |
8.3 |
69.6 |
63.8 |
Summerside
|
Population
(x 1,000) ( [14] ) |
Labour Force
(x 1,000) ( [15] ) |
Unemployment
Rate ( [16] ) |
Participation
Rate ( [17] ) |
Employment
Rate ( [18] ) |
1987 |
13.6 |
8.6 |
12.8 |
63.2 |
54.4 |
1988 |
13.6 |
8.5 |
11.8 |
62.5 |
55.1 |
1989 |
13.8 |
9 |
16.7 |
65.2 |
54.3 |
1990 |
12.8 |
8.1 |
14.8 |
63.3 |
53.1 |
1991 |
12.2 |
7.2 |
22.2 |
59 |
46.7 |
1992 |
12.6 |
7.8 |
17.9 |
61.9 |
50.8 |
1993 |
14.3 |
8.8 |
17 |
61.5 |
51 |
1994 |
14.8 |
9.7 |
17.5 |
65.5 |
53.4 |
1995 |
12.8 |
8 |
12.5 |
62.5 |
54.7 |
1996 |
12.7 |
8.7 |
13.8 |
68.5 |
59.1 |
1997 |
12.8 |
8.7 |
13.8 |
68 |
58.6 |
1998 |
13 |
8.5 |
11.8 |
65.4 |
57.7 |
1999 |
12.9 |
8.8 |
10.2 |
68.2 |
60.5 |
2000 |
13.2 |
8.1 |
9.9 |
61.4 |
55.3 |
2001 |
13 |
8.9 |
11.2 |
68.5 |
60.8 |
2002 |
13 |
8 |
10 |
61.5 |
55.4 |
2003 |
13.1 |
9.2 |
10.9 |
70.2 |
62.6 |
2004 |
13.3 |
9.1 |
11 |
68.4 |
61.7 |
Source: Statistics Canada, Table 282-0064 - Labour force survey estimates (LFS), by selected medium-sized cities, annual (Persons unless otherwise noted).
( [1] ) There are two complicating factors. First, the Census area definition for the Summerside area was changed in 1996. Second, on 1 November 1999, the Canada Customs and Revenue Agency (later the Canada Revenue Agency) became an agency of the government. The change in status means that it is now a separate employer. That is, its employees are no longer part of the core civil service for which Treasury Board is the employer, and detailed employment data are not available after 1999.
( [2] ) Report of the Task Group on the Proposed Closure of CFB Summerside , Submitted to Premier Ghiz, 16 May 1989.
( [3] ) Ibid.
( [4] ) Donald J. Savoie, "Summerside: Revisiting the Base Closure," Canadian Journal of regional Science , Spring 1995, Vol. XVIII, No. 1, pp. 57-79.
( [5] ) Notably, ACOA provided Atlantic Turbines with $4 million in funding and the P.E.I. Development Agency with $1.75 million after it agreed to install engine repair facilities in the park; the SPC agreed to give the company 40% ownership of the facilities if it created 310 jobs over the next 4 years. Bendix-Avelex received a $1.55 million grant from ACOA to establish a repair facility. Source: Donald J. Savoie, Community Economic Development in Atlantic Canada: False Hope or Panacea? , The Canadian Institute for Research on Regional Development (2000).
( [6] ) Atlantic Canada Opportunities Agency, Comprehensive Audit of Slemon Park Corporation, 1995/1996.
( [7] ) Savoie (2000), p.78.
( [8] ) Ibid. , p.80.
( [9] ) The cities in this table are urban centres as defined by the Labour Force Survey. These regions are made up of full or partial Census Subdivisions (CSD), and do not necessarily correspond to Census Agglomerations.
( [10] ) Number of persons of working age. Estimates in thousands, rounded to the nearest hundred.
( [11] ) The unemployment rate is the number of unemployed persons expressed as a percentage of the labour force. Estimates are percentages, rounded to the nearest tenth.
( [12] ) The participation rate is the number of labour force participants expressed as a percentage of the population 15 years of age and over. Estimates are percentages, rounded to the nearest tenth.
( [13] ) The employment rate (formerly the employment/population ratio) is the number of persons employed expressed as a percentage of the population 15 years of age and over. Estimates are percentages, rounded to the nearest tenth.
( [14] ) The cities in this table are urban centres as defined by the Labour Force Survey. These regions are made up of full or partial Census Subdivisions (CSD), and do not necessarily correspond to Census Agglomerations.
( [15] ) Number of persons of working age. Estimates in thousands, rounded to the nearest hundred.
( [16] ) The unemployment rate is the number of unemployed persons expressed as a percentage of the labour force. Estimates are percentages, rounded to the nearest tenth.
( [17] ) The participation rate is the number of labour force participants expressed as a percentage of the population 15 years of age and over. Estimates are percentages, rounded to the nearest tenth.
( [18] ) The employment rate (formerly the employment/population ratio) is the number of persons employed expressed as a percentage of the population 15 years of age and over. Estimates are percentages, rounded to the nearest tenth.
|